 Live Music Archive
 Librivox Free Audio
 Metropolitan Museum
 Cleveland Museum of Art
 Internet Arcade
 Console Living Room
 Books to Borrow
 Open Library
 TV News
 Understanding 9/11
tv [untitled] February 6, 2013 5:00pm-5:30pm PST
5:00 pm
. >> hi, my name is sharon, i'm the graffiti project manager for the city of edmonton, canada. for some of you weren't in my presentation earlier today i'll go through what the city of edmonton is doing in terms of programming but then go through auditing and what we do. capital city clean up brings cities together to create safe,
5:01 pm
clean inviting xhueplts and neighborhoods. our motto is a clean and safe edmonton is a shared responsibility and we work on the premise that we can't do it alone, that we need to work as partners with the community to create solutions to graffiti vandalism and litter enforcement. just a technical point, if any of you want to ask questions, they are recording the session so they would like you to speak into the microphone and if you have any questions along the way, please feel free to ask. when did capital city clean up start? it was launched in 2005 as a pilot program focused on litter reduction in the downtown of edmonton. basically businesses were asked to adopt a block in their area and were responsible for litter clean up in that area and the program had such a huge success that they expanded the program in 2006 to include a residential component for
5:02 pm
litter pick-up. we now have over a thousand adopt a block captains that are responsible for adopting blocks around the city of edmonton for picking up litter and they each have crews of 4 to 5 thousand people so so we have four to five thousand people picking up litter. we link nonprofit organizations with businesses and the businesses pay the nonprofit organizations $650 per summer to have the nonprofits pick up litter in the blocks surrounding their business. the advantage to that is, again, community responsibility. they're not just picking up litter at the businesses, they are picking up litter in the surrounding blocks. we have a school litter reduction program that was started that year as well so we focus on educating schools on
5:03 pm
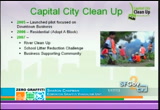
litter pick-up in the city. in 2008 the program was expanded to include graffiti and 2008 was when our by law was amended requiringing property owners it remove graffiti from their property or face a $250 crime. the one success from our program was the council at that time looked at the idea that we can't hold citizens responsible if we're not responsible ourselves, so they created our management program at that time. that includes bylaw enforcement as well as civic clean up and support for property owners. the program expanded again in 2009 to include a cigarette litter reduction program. we have a huge problem in our city with cigarette litter. we found that through our litter audits that we have done, we have a higher rate of cigarette litter in our cities compared to other cities in canada.
5:04 pm
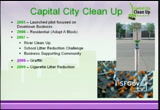
expanded again in 2010 to include needle disposal and i said in the other session, this is what i am escaping from in edmonton right now. yay, san francisco. so we have a snow angel program where we ask citizens to voluntarily shovel the snow off their neighbor's lawns. so these are all the programs offered by the capital city clean up program. we started in 2005 as part of the waste management branch and this past year in 2012 we were moved to the community standards branch which is where we are housed now. so we have a very strong link with our programs between the programs that we offer and the community standards or community bylaw ordinances that we're operating under. the lation that we focus in on is 14614, that is the bylaw
5:05 pm
that governs litter pick up in the city. community standards 146400 is the graffiti standards bylaw. our bylaw is unique to other cities in that we don't focus on the definition of graffiti, we focus on whether or not graffiti is considered a nuisance on a property. so the bylaw is written such that it has to fall within the definition of community standards, the nuisance property and therefore we're not ever restricted by a definition and people arguing whether what's on there fits within a specific definition of graffiti, it all falls within whether what is on the building constitutes a nuisance. it also gives strength to it because we don't run into the possibility if somebody says that, well, i want it there because i gave permission to it, permission is not a factor, it's whether or not it's a nuisance property. in canada some jurisdictions have their bylaws such that
5:06 pm
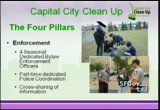
they can charge taggers with fines for doing graffiti tagging. we don't have any such ordinance in our city. graffiti is managed on the enforcement side as a crime under the criminal code of canada. so just quickly i won't go through all of our programs, i did an hour and a half so i could talk forever on our programs. but basically we have our programs for our city are divided into 4 areas. civic operations, we have two graffiti removal vans that clean graffiti on our civic property alone. we do enhanced clean up, we have a contractor that does some additional clean up on city property as well as the clean up that's done by operational departments in the city. and interdepartment coordination is key. we have an operations department,
5:07 pm
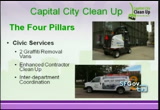
operations committee that's made up of representatives from all the operations areas in the city and through that we coordinate all of our clean up on city infrastructure and we have all of our complaints come in through 311, which is the recording for the city of edmonton for all -- any complaint, recreation sign up, anything comes through 311. but we do manage our calls through that service. we have 4 seasonal bylaw officers that are dedicated to graffiti enforcement. this is -- yeah? >> how many people live in edmonton? >> there's about a million people in edmonton there's about a million. we have 4 seasonal officers that work only on graffiti.
5:08 pm
cost sharing of information of our programs is critical. our bylaw complaints, all the information that's gathered in our bylaw system is, includes information that would be of value to police. so not only do we keep information on which properties are hit, all the tagger information in the city is also tracked through our bylaw system and whenever police are going to make any arrests they have access to our bylaw system. that information is, because it's collected by bylaw, it's prepared and enforcable in a court of law so our officers are able to increase their arrests by
5:09 pm
accessing our bylaw information. our biggest arrest last year, 167 charges were laid against one person and half of that came through our bylaw system. we offer property owner support program and kits. kits are available free of charge, they include a discount on paint from roano which is the equivalent of lowe's or home depot. property owners can access our contractor up to $500 in value to have the contractor go and remove graffiti on the property owner's property free of charge up to $500, then the property
5:10 pm
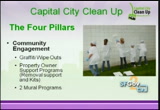
owner is responsible for the balance, but last year 97 percent of the program participants got the graffiti removed by free. what we found was by offering those two programs alone, we found not only do we have a 99.37 compliance rate on our bylaw enforcement, but negative public perception about the bylaw has gone down significantly. i used to get two calls a week of people complaining about the bylaw, i don't get any of it now because we're able to defuse it by telling them about the support programs. i've been talking all afternoon. we also offer two mural programs, one that we fund ourselves directly and one that we offer community groups $2,000 to paint murals in the community. the idea is that that program is a matching program so community groups can match up to $2,000 with any type of community effort so
5:11 pm
they can get an artist to donate the art work, you can get somebody to donate paint, their volunteer hours count against the matching, so all of that is helpful in terms of getting them going. and what we really found is that some groups will use the two thousand and spend 12,000 on doing a mural. the best one i've seen, we had a high school do two dugouts that were constantly being hit, it cost them $750 and we have no problem with the dugouts any more. public awareness, we have a very, very substantial public awareness campaign. we have media support from all of our local radio, television and print media outlets and the other presentation i did, if anyone is interested i can show you some of the clips but we have basically almost every radio station in town is producing -- and television station in town is producing video clips they are airing for us, promoting our programs, calling 311, et cetera. so it's been very beneficial.
5:12 pm
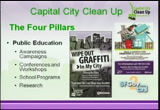
we do conferences and workshops, we hosted the tags conference in edmonton last year, we're developing school programs, we have a program designed for grade 6 students, we're looking at a restoretive program this year so we're very active in the community. so that's our program in a nutshell, 15 minutes and it doesn't really give it justice to some of the nuances but it gives you a sense of the different types of activities that we're doing. so what does that mean? we've been doing a lot, how are we doing, how is edmonton really doing? what we found when we started the program, i was thrown in, in 2008, they said come up with a graffiti program. i know nothing about graffiti, i'm a communications director and i manage projects so how am i going to come up with what we are doing. we had someone on light duty from the corporate properties
5:13 pm
department going around in neighborhoods in our business revitalization zones trying to count and tell us how much graffiti was there. well, that was all very well and good but the graffiti we could find was only, the numbers were only significant to the capabilities of the person that was finding it. it wasn't giving us any real sense of whether we were increasing in graffiti vandalism, whether it was decreasing. we had been working with mgm management on our litter audits, we had been doing capital city clean up starting in 2007 started doing litter audits where we hired mgh management -- mark is the auditor who do our litter audits and now was doing our graffiti audits. basically, we looked at what we were doing on our litter audit and said there's got to be a more scientific, for lack of a better way, or statistical way of looking at how much graffiti was in a city and how we were
5:14 pm
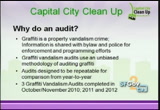
really doing. so what we did -- so why do an audit? graffiti is a property vandalism crime. information we share from our audits are shared with bylaw and police and affect our enforcement and programming efforts. so what we're doing is taking the information that we gather from our audits and we're changing our programming accordingly. so i am able to track what's going on in each neighborhood to determine where i need to deploy my graffiti removal van, where i need to put my wipe out program, where i need to maybe come up with a mural, where i need to work with the arts council, whether i want to or not, pardon my expression, on free walls, which i don't agree with. but they have been very helpful in us really monitoring and having some proof at city effectiveness because somebody asked me in the other presentation, you've got all these programs, you've got clean up programs, how much are you spending on your program?
5:15 pm
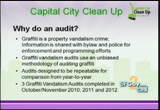
we're spending a million dollars a year and everybody is saying, well, you know, how do you justify where you are putting those dollars? and i'm justifying putting those dollars because i can take my graffiti audit and say i know that this is where the graffiti is happeninging in the city. this is where the taggers are moving around and that information is then also shared with the edmonton police service and they are using that information in terms of going after which taggers so it's critical for a city to really look at not just anecdotally look at whether your graffiti is going up or down, it has to do with how effective you can make your programming. the graffiti audit program we have come up with, we looked everywhere to see if there was anybody doing any type of statistical analysis on graffiti vandalism in cities and we weren't able to find any so the model you will see is we
5:16 pm
worked with mark mckinney and management and worked as a team to see how we could view how graffiti affects the city. these audits are designed to be repeatable from year to year. we have done 3 audits to date and we have been able to effectively determine how we are doing. so what's the methodology? i don't know if you can see that map very well. that map is a map of the city of edmonton. all of the purple areas and the dark purple areas outline where the complaints were coming in, into the city over the past year. i actually should have put the 2010 map, i don't know what i was thinking, but anyway, this gives you a sense of where the graffiti complaints are. so the first category i think is 0 to 40, 50 to 90, 100, et cetera, so we get a sense of what's going on in the city. so what we did, we had no idea specifically where the graffiti was happening. what we did we took all of the graffiti complaints from the start of
5:17 pm
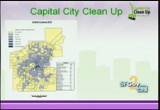
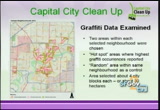
the program, 2008 to 2010, we took all the graffiti notifications that went into our bylaw system, be they calls that went in or be they officer-initiated complaints and we mapped out what were the top 20 neighborhoods that had reported graffiti vandalism. based on that, we selected the top 20 neighborhoods and determined those would be the neighborhoods we would audit. let's go in and see if the neighborhoods reporting graffiti are the ones where graffiti actually is. do you just have a more vocal community in that area, do you have an organization on a mission or do you have more graffiti. i won't go into too much information about the 5 neighborhoods, but every year we do a comparison map between our original data set and what we're seeing in each given year to determine if we're having fluctuations in reporting. we haven't done a lot with the information in terms of where the changes in reporting
5:18 pm
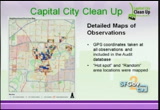
because the top 20 neighborhoods have remained almost consistent from year to year, but we did do an additional 5 neighborhoods in 2012 just to see if there was any change and we found very little difference. but basically how we've analyzed each neighborhood is that in those top 20 neighborhoods there's further analysis that was done that determined what are the hot spots within the neighborhood. you can't, a city the size of ours, like i said, it's a million people. it's not like we can audit and go through every neighborhood to determine where the graffiti was. so within each neighborhood we selected a 4-block area that was a hot spot area and then a random area within that neighborhood where there wasn't necessarily that much graffiti. each 4 block area was -- sorry, i lost my traib of thought for a minute there -- it was about 4 city blocks or
5:19 pm
30 hectares of land. >> 12 acres. >> 12 acres, thank you. in each location the auditors examined each street, alley, they went street by street, alley by alley, road way, driveway, anything they could do, and they recorded all the graffiti they found. at each location, each location where the graffiti was found was given a graffiti location identification that included latitude and longitude. each location was mapped using a gps -- garmin gps so we were able to locate those locations for comparison purposes, photo was taken of each graffiti, site was characterized whether it was a hot location in the
5:20 pm
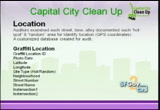
neighborhood, if it didn't have a street name the intersection of the location the graffiti was also determined. at each location, then, there could have been 10 pieces of graffiti, there could have been 5. each piece of graffiti was given a unique graffiti identification code, the target property, and i'll go through some definitions what these are, but the side, the tagger name, the crew name, the time of the photo, which categories it fit in, which descriptors, all that information was recorded about each piece of graffiti at that location. so, for example, size. how do you categorize size. what we did was come up with predetermined classifications about what we could categorize as size and we looked at the types of graffiti that we were seeing in the city and what are the sort of the -- what are we trying to get? do i want to know if someone wrote his name or do i want to know if he did a big piece. so the sizes were arranged how you would classify
5:21 pm
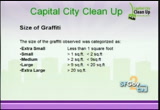
or what you would see on an average piece of wall. so less than 1 square foot was extra small, small, medium, large, and we looked at those categories in that way. style of the graffiti. each piece of graffiti was given a characteristic or determination what you were seeing for the graffiti. again, you can't analyze each piece so we created categories that would identify each piece of graffiti so we could compare it from one location to the next. for example, plain text, an artistic tag, bubble outlines, whether they had time to do just the outline, if they had time to do one color, two color, or whether it was a full throw up piece. we categorized the information that way. the descriptor of the graffiti, we catalyzed whether it was hate, whether it was a sentence sill, whether it was vulgar, a political motif, it whether it was racist, all
5:22 pm
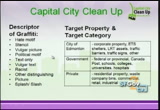
those characteristics were recorded in a data base that were kept on a laptop as they went neighborhood through neighborhood. the target category was also determined. if they could determine if it was on city property or government or private, that information was logged so we could have a sense of where the taggers were targeting. who were they focusing in on? 509 thing that was interesting that was mark's idea was to track where they went next. the areas weren't exactly the same and they weren't uniform in size, so we wanted to have a way of measuring where or what the intensity of the graffiti was over a particular area of space. so what we did was -- or mark did -- was develop a graffiti index which takes the
5:23 pm
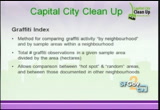
number of tags in a specific area and divides it by the hectares or acres of land in that area, giving you a unique value for that neighborhood in terms of how much graffiti was there. this allows us to be able to have comparisons not only between neighborhoods but also within the neighborhood between the hot spot and the random area. a unique factor --. >> i was wondering why 4 blocks by 4 blocks was selected. >> it was just determined as a managable space, given the budget we had and the time period we had to do it. it takes about two weeks in terms of field data collection. anything longer than that we're getting into it being over a period of time. this is really a snapshot look at what's going on in a neighborhood, so we had to do something that was managable. ideally we would have done the entire neighborhood but this was a way of giving us some comparison as
5:24 pm
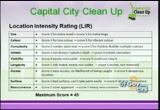
well as making it feasible to do. one of the things that was added into the 2011 audit following the graffiti tags conference -- because we're all learning, right? we came up with a will he case intensity rating for each location. whereas with the other categories where i talked about size where we are actually recording the specific sizes, what these categories do, this is a visual inspection of the graffiti at each side. we looked at 9 categories, size, color, complexity, artistic, access and recurrence of it. low score of 1 means, for example, size is small. we use the same for size we use the same categories. 5 was extra large. color, whether it's light in color, very vibrant or not. what this does is it allows us to actually have a rating for every piece of,
5:25 pm
every location where the graffiti is. so when we've done our graffiti audit and we'll show you maps of it, we're actually visible map and show where the graffiti is the most intense in the various neighborhoods. again, it helps us show where the graffiti taggers are moving around and how we're able to compare from year to year in terms of where their movements are and what type of graffiti is there. so what are our results? is it going to be too dark if i turn off the other light? i just thought maybe -- this map -- is that better? so basically using the gps coordinates, this is mapping out all the graffiti in the city of edmonton that we found over the 3 years of our graffiti audit across the course of the map. they are mapped out by hot spot and by
5:26 pm
random area. so what did we find? we found that from 2010 to 2011 we had 15.9 percent reduction in the number of locations where graffiti was found, an additional 14.4 percent this year in the number of locations. so what that's telling us is the graffiti tagging is becoming centralized into some of those locations. it's not the blanket approach. so it could affect and hopefully will inform us in terms of how our enforcement efforts are being done, as well as some of our clean up efforts if they are pushing into certain areas. so basically as far as the location where the graffiti is found, we've seen a 28 percent decrease. from 2010 to 2011 we had a huge drop in our graffiti, the amount of graffiti incidents that we were seeing, 42.7 percent reduction. what we did see this year was the amount of graffiti
5:27 pm
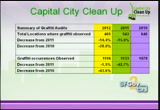
stagnated in terms of we may have had fewer locations of graffiti but we weren't seeing any less graffiti. so, again, the graffiti is becoming concentrated into those locations. it's important for us to be able to know that in terms of how we're addressing our graffiti enforcement and programming efforts. so this is a map, just mapping out the results. so we're seeing a trending down in terms of the location and so next year will be very important for us it note to see where we go. are we continuing to trend down in locations? again, that would help us in terms of doing wipe outs and some of our maybe community murals in some of those high pockets areas or is the graffiti going to continue to stagnate in that area. in our graffiti index, just as i mentioned before so we are examining the observations providing a numerical
5:28 pm
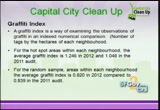
observation of the number of hectares in each area. in our hot spot we are fieplding there is more graffiti in the hot spots compared to the random areas. so that tells us we can rely on the calls coming in -- i don't think i have any other maps so i can turn that up so we're not sitting in the dark. basically what we're finding then is it is making a difference looking at the hot spots compared to the random sampling. so within a given year we should be able to look at trends coming in from our 311 system as well as officer-initiated xlaipblts to see if there are hot spots again right on the spot instead of retroactively -- we should be able to trust where the calls are coming in. now we have impeer cal proof that we can start looking at the calls as they are coming in.
5:29 pm
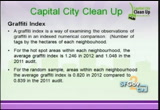
in the random sample area the graffiti index averaged 8.2 compared to 8.39. again, they are fairly consist kupb stepblt from year to year. the hot spot increased in terms of its area. what we found again, 9 out of 20 neighborhoods had lowered graffiti indexes than last year, which makes sense we only had a 1.5 decrease in the amount of graffiti. it does tell us that the taggers are moving around from one neighborhood to the next, telling us how we should be managing or programs or which neighborhoods we should be looking at. this is a graphic analysis of the neighborhoods. i don't have a pointer, i'll get my head out of the way. downtown was one of our key problem areas that we started out with but we're
59 Views
IN COLLECTIONS
SFGTV2: San Francisco Government Television Television Archive
  Television Archive News Search Service
Uploaded by TV Archive on
